Visualization Guide
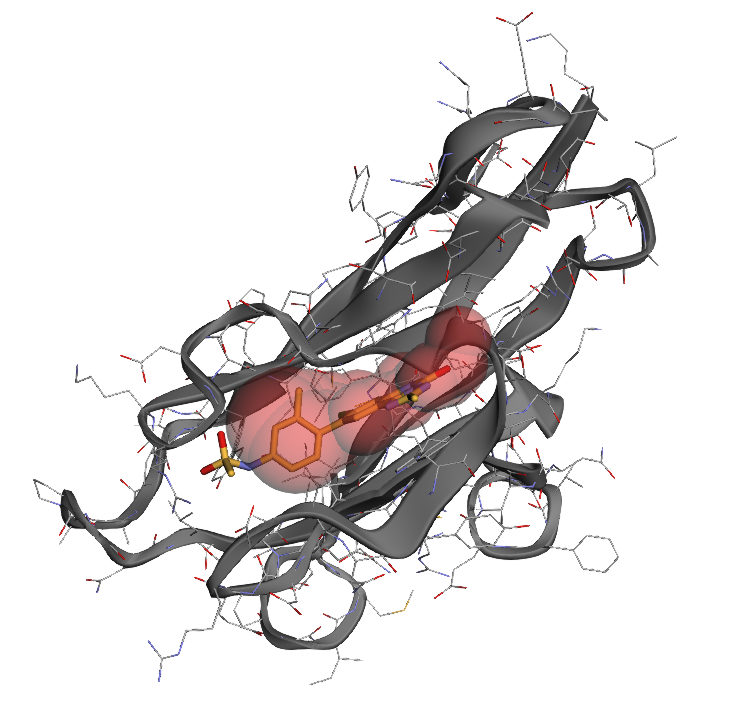
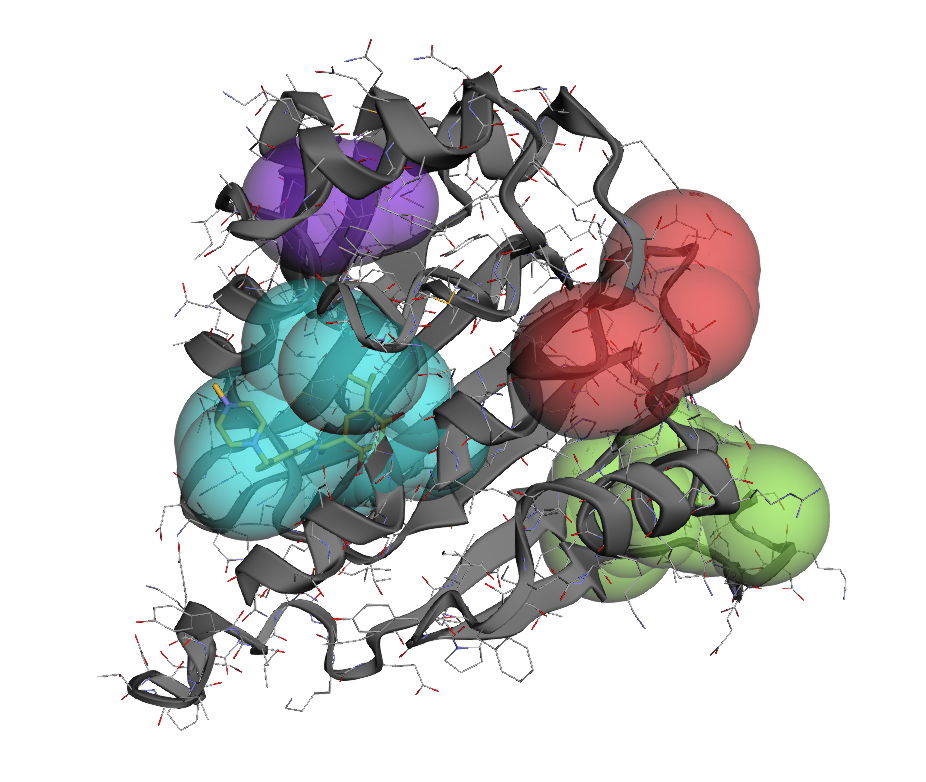
This guide shows you how to use Pocketeer's visualization features in a Jupyter notebook to explore detected protein pockets. The visualization function in Pocketeer is a wrapper around atomworks.io.utils.visualize.view, and displays detected pockets as colored spheres for intuitive exploration.
Prerequisites
First, install Pocketeer with visualization support:
pip install pocketeer[vis]
Or install the visualization dependency separately:
pip install atomworks
Basic Visualization in Jupyter
Here's a simple example to get you started:
import pocketeer as pt

# Load a protein structure
atomarray = pt.load_structure("protein.pdb")

# Detect pockets
pockets = pt.find_pockets(atomarray)

print(f"Found {len(pockets)} pockets")

# Create interactive visualization
viewer = pt.view_pockets(atomarray, pockets)
viewer.show()  # This will display in the notebook
Customizing the Visualization
Different Color Schemes
# Rainbow colors (default)
viewer1 = pt.view_pockets(atomarray, pockets, color_scheme="rainbow")

# Grayscale
viewer2 = pt.view_pockets(atomarray, pockets, color_scheme="grayscale")

# Red-blue with transparency
viewer3 = pt.view_pockets(
    atomarray, pockets,
    color_scheme="red_blue",
    sphere_opacity=0.5
)

# Show each visualization
viewer1.show()
viewer2.show()
viewer3.show()
Adjusting Sphere Appearance
# Make spheres more transparent and smaller
viewer = pt.view_pockets(
    atomarray, pockets,
    sphere_opacity=0.3,  # More transparent
    sphere_scale=0.8     # Smaller spheres
)
viewer.show()
Complete Notebook Example
Here's a complete example you can copy into a Jupyter notebook cell:
import pocketeer as pt
import urllib.request

pdb_code = "4tos"

# Download the pdb file for demonstration
pdb_filename = f"{pdb_code.upper()}.pdb"
url = f"https://files.rcsb.org/download/{pdb_code.upper()}.pdb"
urllib.request.urlretrieve(url, pdb_filename)

# Load structure
atomarray = pt.load_structure(pdb_filename)

# Detect pockets
pockets = pt.find_pockets(atomarray)

# Display results
print(f"\nFound {len(pockets)} pockets:")
for pocket in pockets[:5]:  # Show top 5
    print(f"  Pocket {pocket.pocket_id}: score={pocket.score:.2f}, "
          f"volume={pocket.volume:.1f} ų, "
          f"spheres={pocket.n_spheres}")

# Create visualization
viewer = pt.view_pockets(atomarray, pockets)
viewer.show()